This post explains how to avoid overlapped text with automatic positioning in ggplot2 plots using the ggrepel package.
This post showcases the key features of ggrepel and provides a set of graph examples using the package.
The ggrepel package in R is an extension of the ggplot2 package, designed to simplify the process of avoiding overlapped texts in plots.
It offers 2 main functions: geom_text_repel() and geom_label_repel()
✍️ author → Kamil Slowikowski
⭐️ more than 1000 stars on github
To get started with ggrepel , you can install it directly from CRAN using the install.packages function:
install.packages("ggrepel")The ggrepel package allows you to display labels using a single geom and invert the functions geom_text_repel() and geom_label_repel() without constraint:
Here’s a basic example:
library(ggplot2) library(ggrepel) data(iris) ggplot(iris, aes(Sepal.Width, Sepal.Length, label=Species, color=Species)) + geom_text_repel()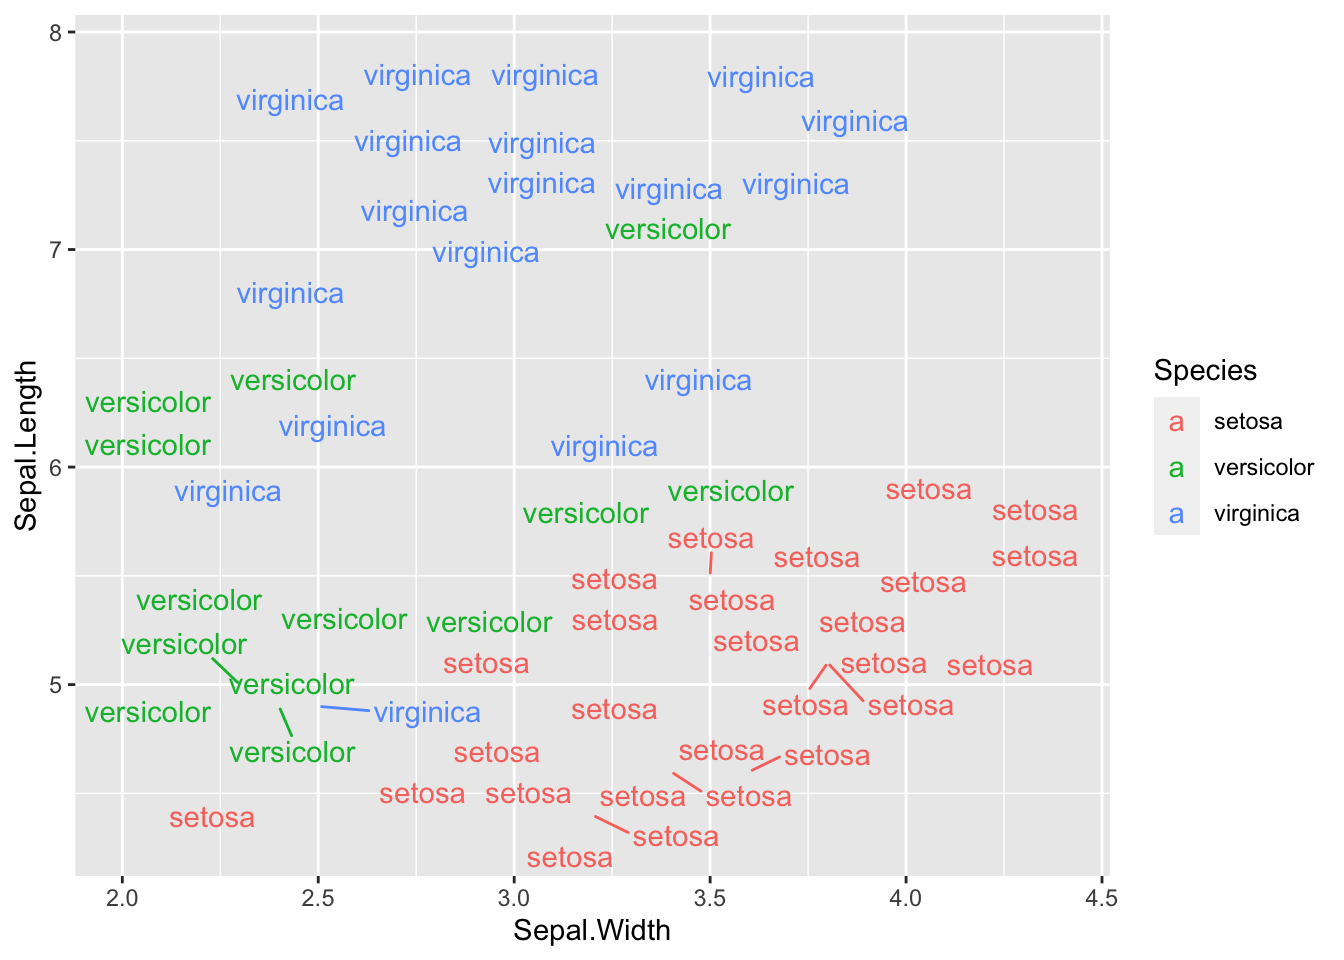
You can labels on individual data points with the geom_label_repel() function. All points will not be displayed if there is not enough room for them, but you can force it with the max.overlaps argument (check below).
library(ggplot2) library(ggrepel) data(iris) ggplot(iris, aes(Sepal.Width, Sepal.Length, label=Species, color=Species)) + geom_label_repel() + geom_point() + theme_classic(base_size = 16) + theme(legend.position = "none") 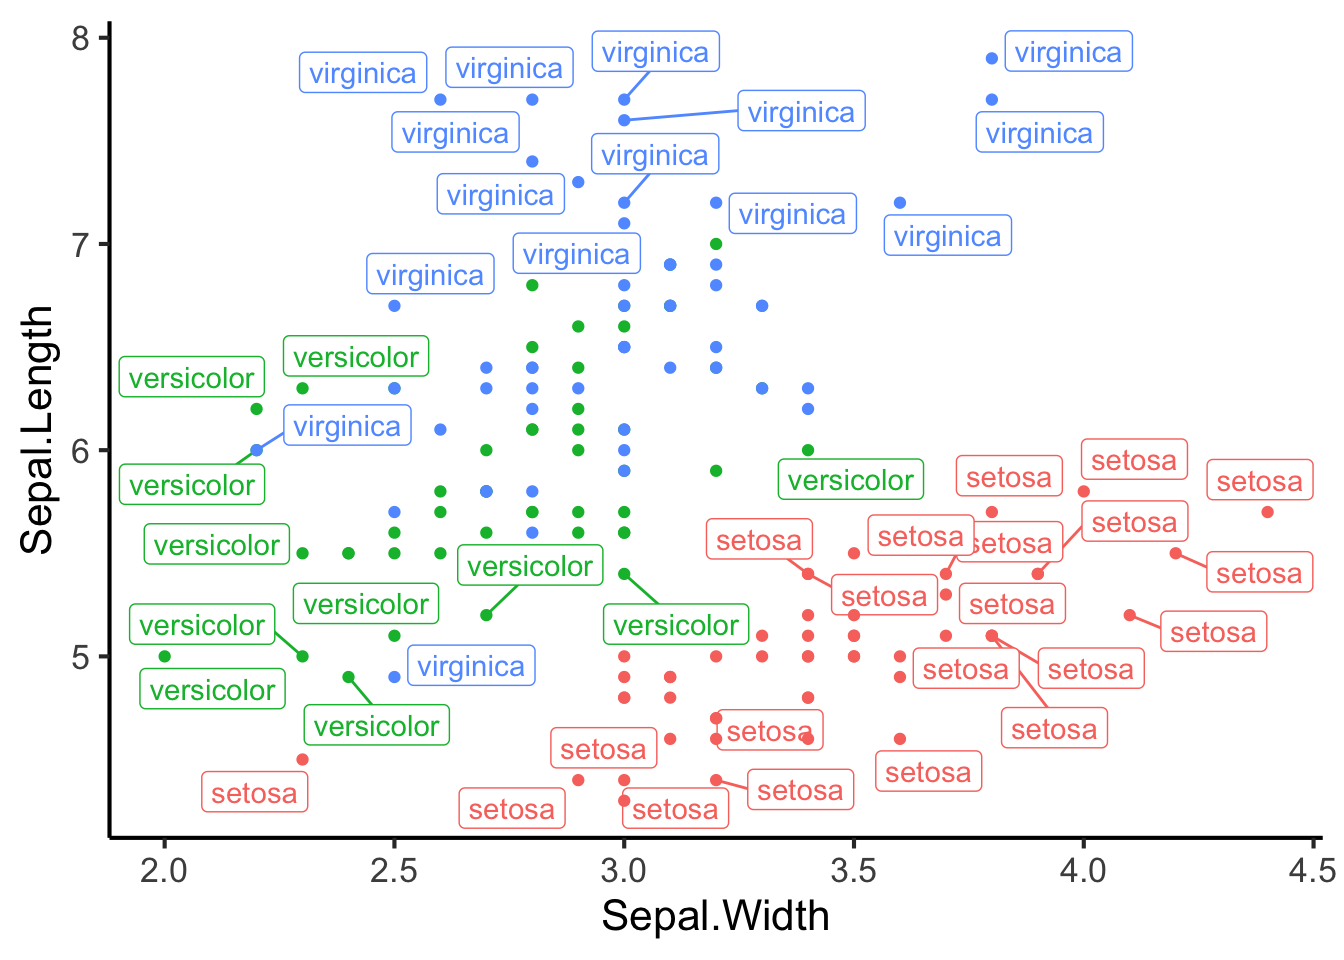
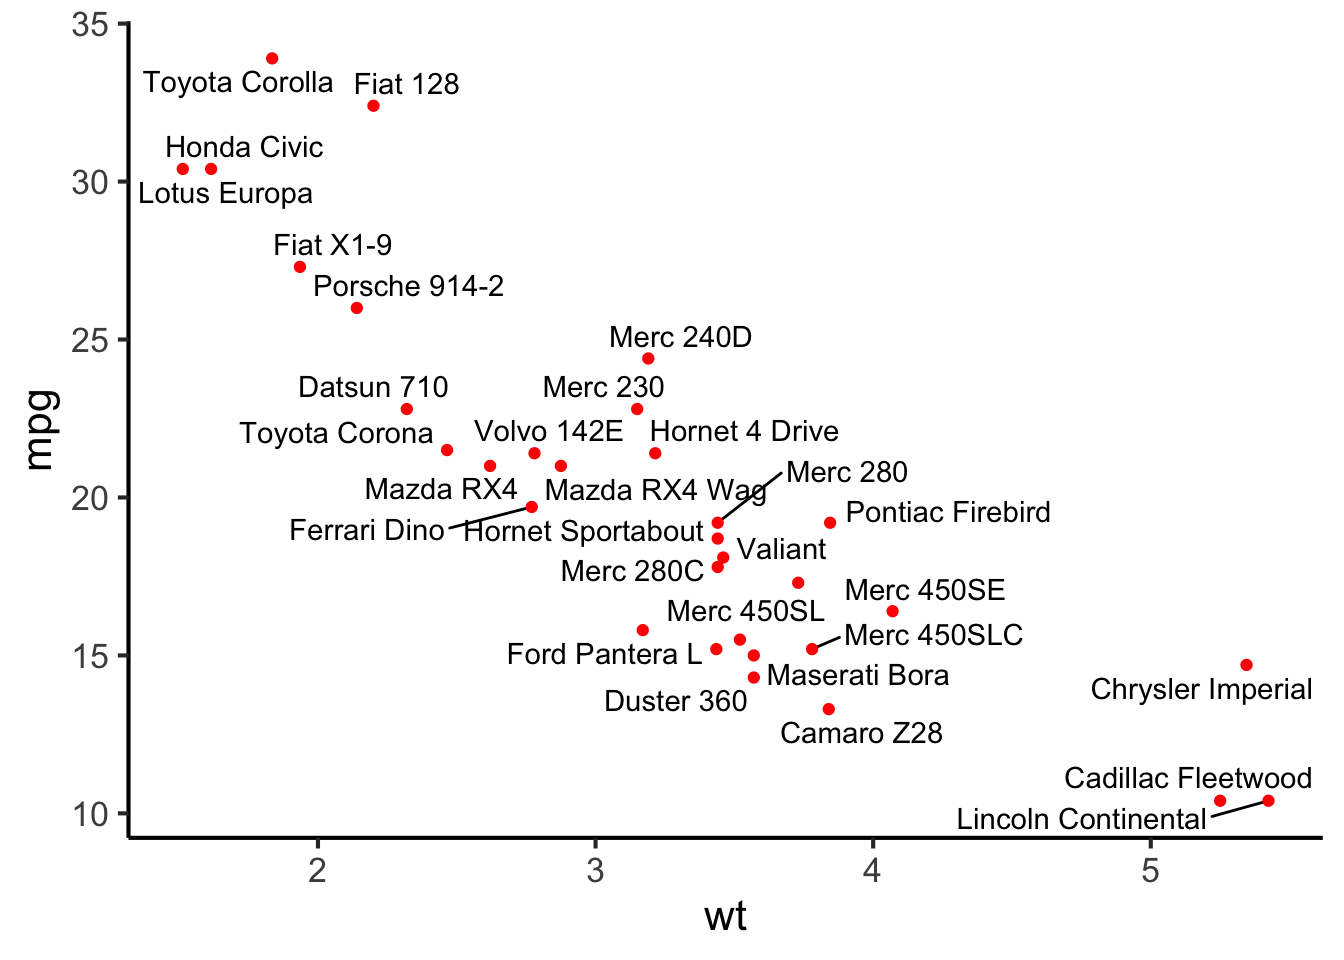
The easiest way to display only some labels is to create a new column on your dataframe with a non-empty value only for the observations you’re interested in.
# Create a new columns with the label only for row 2,3 and 14 mtcars$car = "" idx_to_label = c(2, 20, 14) mtcars$car[idx_to_label] = rownames(mtcars)[idx_to_label] # Display the result ggplot(mtcars, aes(wt, mpg, label = car)) + geom_text_repel() + geom_point(color = ifelse(mtcars$car == "", "grey50", "red"))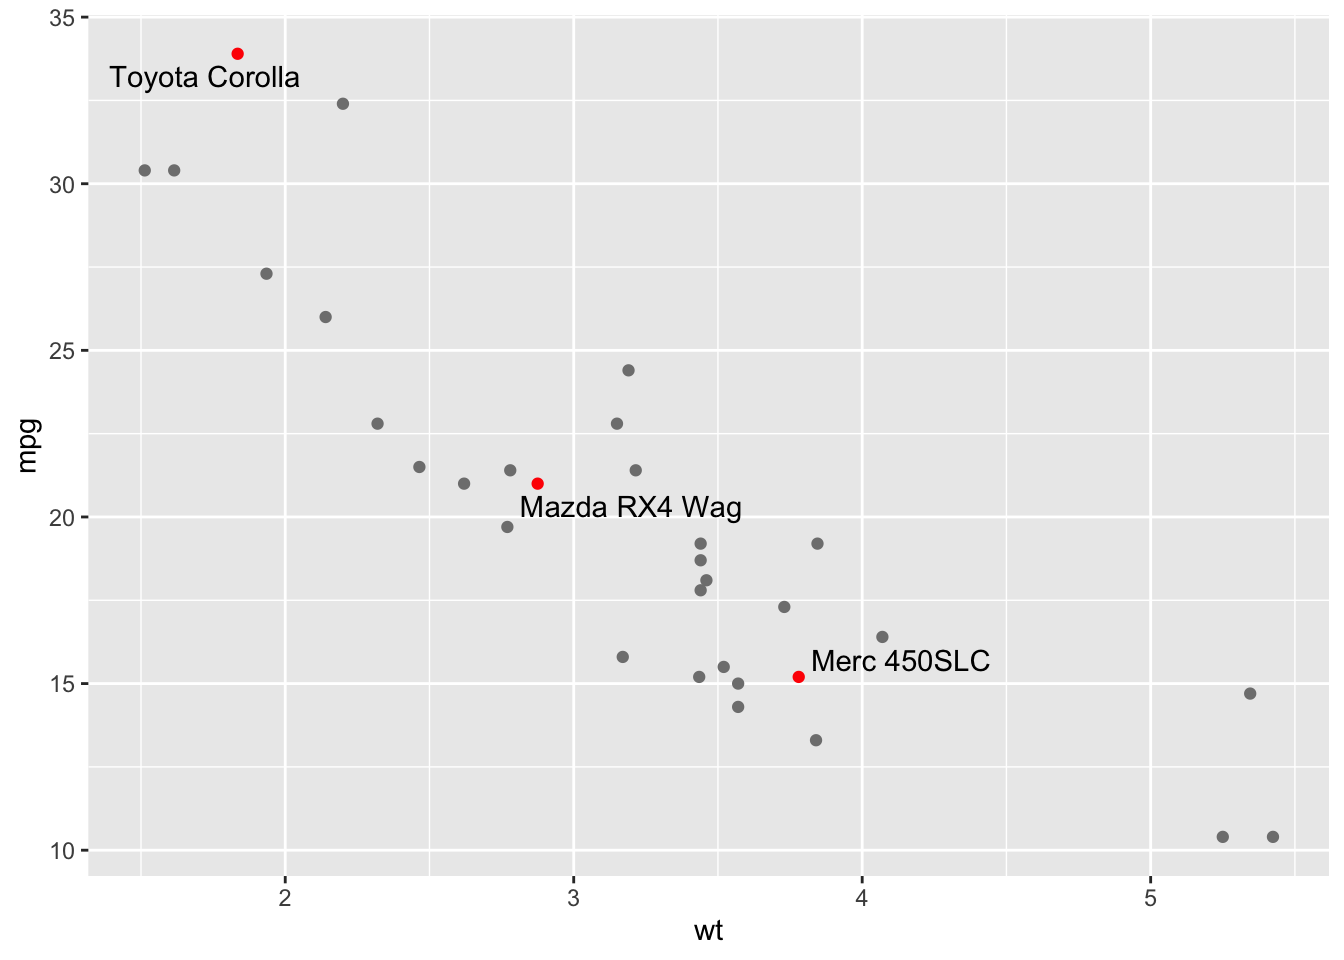
The geoms provided by ggrepel try do avoid as much as possible overlapping, with a maximum of 10 by default. However, you can change this value if overlapping is not a problem for you with the max.overlaps argument!
library(ggplot2) library(ggrepel) data(iris) ggplot(iris, aes(Sepal.Width, Sepal.Length, label=Species, color=Species)) + geom_text_repel(max.overlaps=nrow(iris)) + # ensure all data points are displayed geom_point() + theme_classic(base_size = 10) + theme(legend.position = "none") 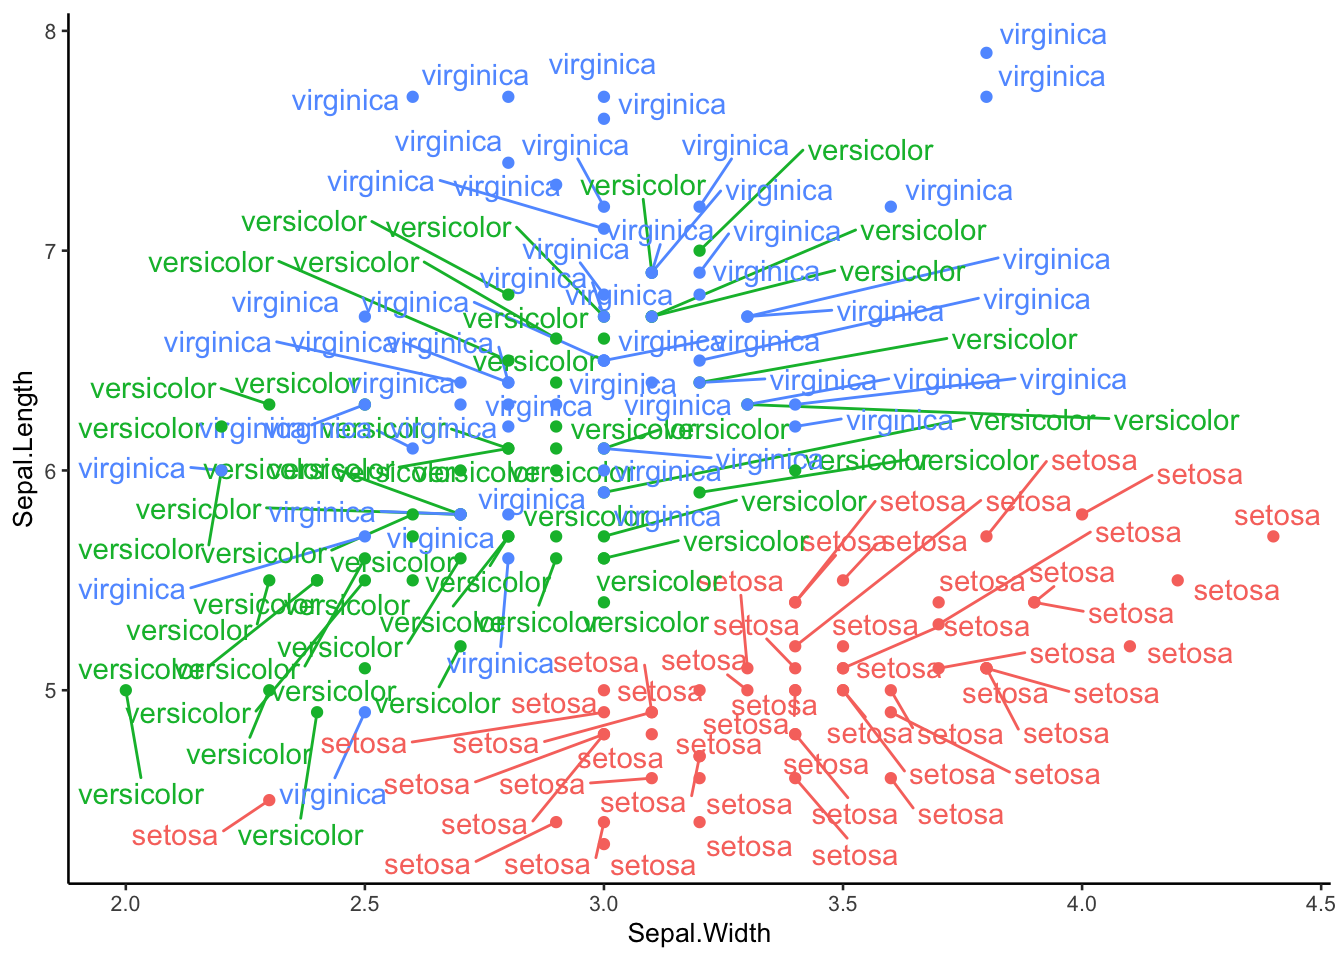
library(hrbrthemes) df = data.frame(x1 = 1, y1 = rnorm(10), x2 = 2, y2 = rnorm(10), lab = state.name[1:10]) ggplot(df, aes(x1, y1, xend = x2, yend = y2, label = lab, col = lab)) + geom_segment(size = 0.5) + guides(color = "none") + # remove legend theme_bw() + # change background color and overall theme geom_text_repel(nudge_x = -0.2, direction = "y", hjust = "right") + geom_text_repel(aes(x2, y2), nudge_x = 0.1, direction = "y", hjust = "left")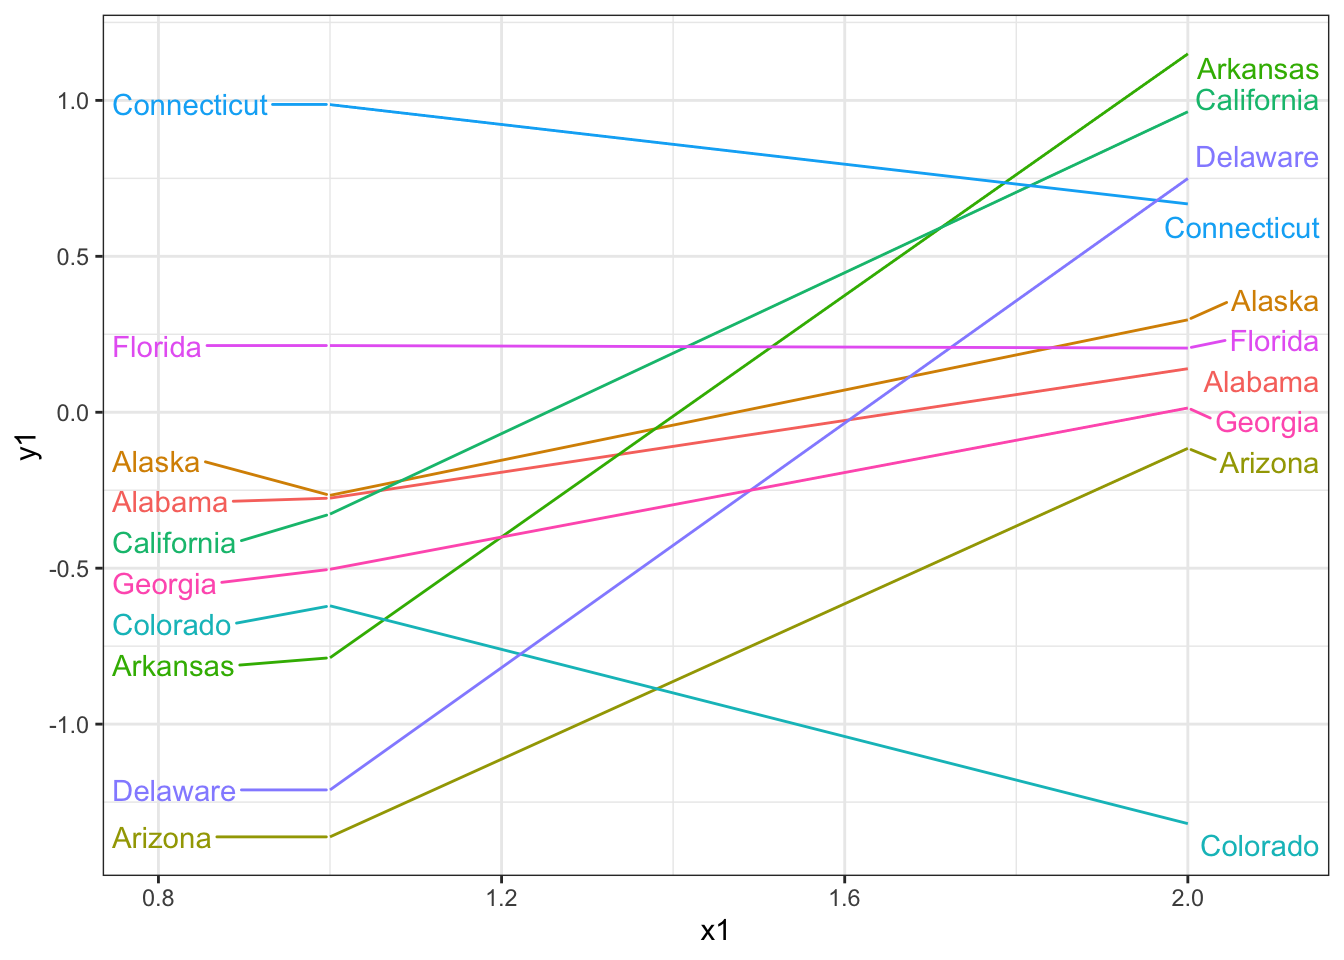
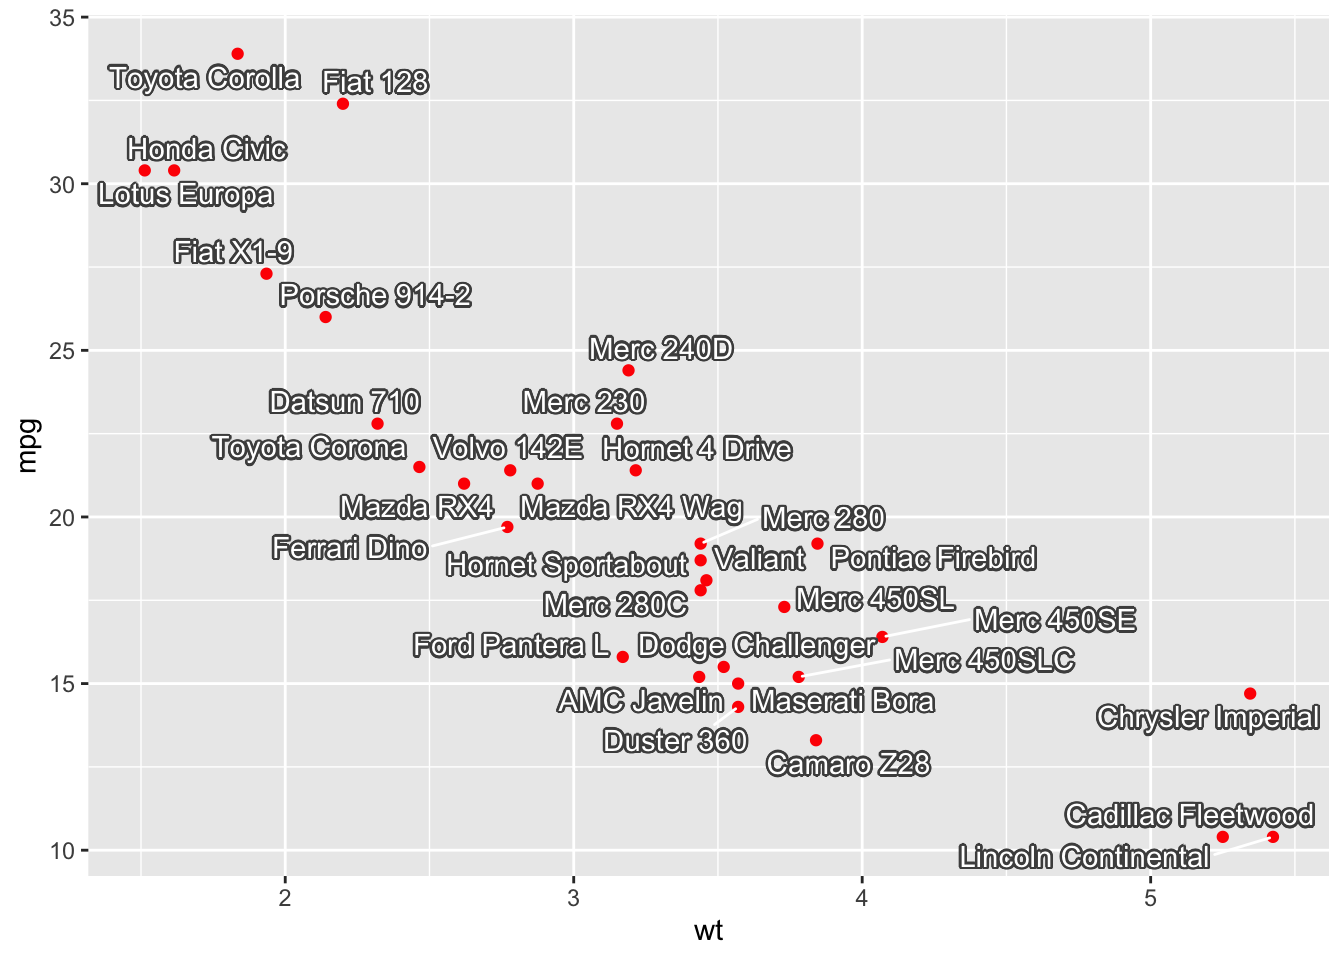
Thanks to the color , bg.color and bg.r , you can change colors of your labels.
mtcars$car = rownames(mtcars) ggplot(mtcars, aes(wt, mpg, label = car)) + geom_point(color = "red") + geom_text_repel(color = "white", # text color bg.color = "grey30", # shadow color bg.r = 0.12) # shadow radius